
Using ChatGPT to Learn Python#
https://chat.openai.com/c/3614d876-1ef2-4483-af09-1478d656933f
# Import necessary libraries
import pandas as pd
import matplotlib.pyplot as plt
# Load the Titanic dataset
url = "https://web.stanford.edu/class/archive/cs/cs109/cs109.1166/stuff/titanic.csv"
titanic_data = pd.read_csv(url)
# Display the first few rows of the dataset
titanic_data.head()
| Survived | Pclass | Name | Sex | Age | Siblings/Spouses Aboard | Parents/Children Aboard | Fare | |
|---|---|---|---|---|---|---|---|---|
| 0 | 0 | 3 | Mr. Owen Harris Braund | male | 22.0 | 1 | 0 | 7.2500 |
| 1 | 1 | 1 | Mrs. John Bradley (Florence Briggs Thayer) Cum... | female | 38.0 | 1 | 0 | 71.2833 |
| 2 | 1 | 3 | Miss. Laina Heikkinen | female | 26.0 | 0 | 0 | 7.9250 |
| 3 | 1 | 1 | Mrs. Jacques Heath (Lily May Peel) Futrelle | female | 35.0 | 1 | 0 | 53.1000 |
| 4 | 0 | 3 | Mr. William Henry Allen | male | 35.0 | 0 | 0 | 8.0500 |
# Basic statistics about the numerical columns
titanic_data.describe()
| Survived | Pclass | Age | Siblings/Spouses Aboard | Parents/Children Aboard | Fare | |
|---|---|---|---|---|---|---|
| count | 887.000000 | 887.000000 | 887.000000 | 887.000000 | 887.000000 | 887.00000 |
| mean | 0.385569 | 2.305524 | 29.471443 | 0.525366 | 0.383315 | 32.30542 |
| std | 0.487004 | 0.836662 | 14.121908 | 1.104669 | 0.807466 | 49.78204 |
| min | 0.000000 | 1.000000 | 0.420000 | 0.000000 | 0.000000 | 0.00000 |
| 25% | 0.000000 | 2.000000 | 20.250000 | 0.000000 | 0.000000 | 7.92500 |
| 50% | 0.000000 | 3.000000 | 28.000000 | 0.000000 | 0.000000 | 14.45420 |
| 75% | 1.000000 | 3.000000 | 38.000000 | 1.000000 | 0.000000 | 31.13750 |
| max | 1.000000 | 3.000000 | 80.000000 | 8.000000 | 6.000000 | 512.32920 |
# Number of passengers in each class
class_counts = titanic_data['Pclass'].value_counts()
print("\nNumber of passengers in each class:")
print(class_counts)
Number of passengers in each class:
3    487
1    216
2    184
Name: Pclass, dtype: int64
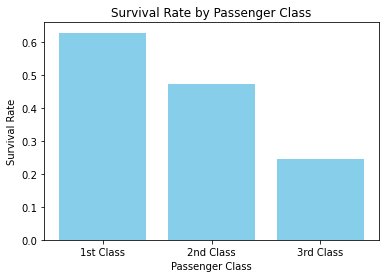
# Survival rate by passenger class
survival_by_class = titanic_data.groupby('Pclass')['Survived'].mean()
print("\nSurvival rate by passenger class:")
print(survival_by_class)
Survival rate by passenger class:
Pclass
1    0.629630
2    0.472826
3    0.244353
Name: Survived, dtype: float64
# Plotting survival rate by passenger class
plt.figure(figsize=(6, 4))
plt.bar(survival_by_class.index, survival_by_class.values, color='skyblue')
plt.xlabel('Passenger Class')
plt.ylabel('Survival Rate')
plt.title('Survival Rate by Passenger Class')
plt.xticks([1, 2, 3], ['1st Class', '2nd Class', '3rd Class'])
plt.show()
# Median age of passengers
median_age = titanic_data['Age'].median()
print(f"\nMedian age of passengers: {median_age} years")

# Number of passengers with siblings or spouses aboard
siblings_spouses_count = titanic_data['Siblings/Spouses Aboard'].sum()
print(f"\nNumber of passengers with siblings or spouses aboard: {siblings_spouses_count}")

# Number of passengers with parents or children aboard
parents_children_count = titanic_data['Parents/Children Aboard'].sum()
print(f"Number of passengers with parents or children aboard: {parents_children_count}")
Median age of passengers: 28.0 years

Number of passengers with siblings or spouses aboard: 466
Number of passengers with parents or children aboard: 340