Economic Complexity and Product Complexity#
Economies grow by upgrading the products they produce and export. The technology, capital, institutions, and skills needed to make newer products are more easily adapted from some products than from others. Here, we study this network of relatedness between products, or “product space,” finding that more-sophisticated products are located in a densely connected core whereas less-sophisticated products occupy a less-connected periphery. Empirically, countries move through the product space by developing goods close to those they currently produce. Most countries can reach the core only by traversing empirically infrequent distances, which may help explain why poor countries have trouble developing more competitive exports and fail to converge to the income levels of rich countries.
Hausmann, R., Hidalgo, C. A., Bustos, S., Coscia, M., Simoes, A., & Yıldırım, M. (2013). The Atlas of Economic Complexity: Mapping Paths to Prosperity (Part 1). Retrieved from https://growthlab.cid.harvard.edu/files/growthlab/files/atlas_2013_part1.pdf
Hidalgo, C. A., Klinger, B., Barabasi, A.-L., & Hausmann, R. (2007). The Product Space Conditions the Development of Nations. Science, 317(5837), 482–487. http://doi.org/10.1126/science.1144581
%load_ext autoreload
%autoreload 2
import pandas as pd
import scipy.sparse.linalg
import scipy
from scipy import sparse
from ECI2 import *
The autoreload extension is already loaded. To reload it, use:
  %reload_ext autoreload
4 digit sitc trade data#
import pandas as pd
import numpy as np
import seaborn as sns
from ecomplexity import ecomplexity
# Import trade data from CID Atlas
data = pd.read_csv('../data/country_partner_sitcproduct4digit_year_2017.zip', compression="zip", low_memory=False)
data.head()
# Calculate eci's
data = data[['year','location_code','sitc_product_code','export_value','sitc_eci']]
data = data[data.year==data.year.max()]
trade_cols = {'time':'year', 'loc':'location_code', 'prod':'sitc_product_code', 'val':'export_value'}
cdata = ecomplexity(data, trade_cols)
cdata = cdata[['location_code','eci','sitc_eci']].drop_duplicates(['location_code'])
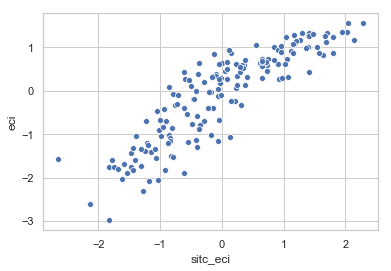
# Compare against Atlas
sns.scatterplot('sitc_eci','eci', data=cdata)
/Users/datalab/anaconda3/lib/python3.7/site-packages/ecomplexity/ComplexityData.py:54: UserWarning: Duplicate values exist, keeping the first occurrence
  'Duplicate values exist, keeping the first occurrence')
2017
<matplotlib.axes._subplots.AxesSubplot at 0xa1cceb5c0>
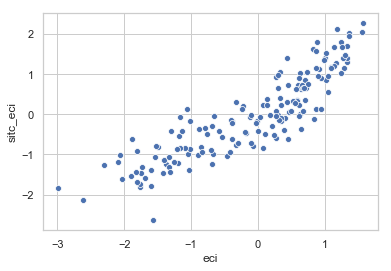
# Compare against Atlas
sns.scatterplot('eci','sitc_eci', data=cdata)
<matplotlib.axes._subplots.AxesSubplot at 0xa1cc3a550>
cdata[:10]
| location_code | eci | sitc_eci | |
|---|---|---|---|
| 0 | ABW | 0.835738 | NaN |
| 4631 | AFG | -1.378222 | -1.237445 |
| 9680 | AGO | -1.764049 | -1.822037 |
| 18791 | AIA | 1.165619 | NaN |
| 19869 | ALB | -0.688075 | -0.288839 |
| 25952 | AND | 0.328331 | 1.066444 |
| 28707 | ANS | 0.606416 | 0.734075 |
| 30727 | ARE | 0.460639 | 0.057493 |
| 38576 | ARG | -0.386276 | -0.156561 |
| 44106 | ARM | 0.000319 | -0.416436 |
# To download gdp data from wordbank
# https://data.worldbank.org/indicator/ny.gdp.pcap.cd?most_recent_year_desc=true
df_gdp = pd.read_csv('./GDP/API_NY.GDP.PCAP.CD_DS2_en_csv_v2_41089.csv', sep = '\t')
year =2017
df_g = df_gdp[['Country Code', str(year)]]
gdp_dict =dict(zip(df_g['Country Code'],df_g[str(year)]))
cdata['gdp'] = [gdp_dict[name] if name in gdp_dict else 0.0 for name in cdata['location_code']]
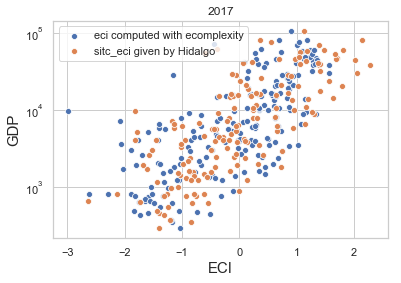
# Compare against Atlas
df = cdata[cdata['gdp'] >0]
sns.scatterplot('eci','gdp', data=df, label = 'eci computed with ecomplexity')
sns.scatterplot('sitc_eci','gdp', data=df, label = 'sitc_eci given by Hidalgo')
plt.yscale('log')
plt.legend()
plt.xlabel('ECI', fontsize = 15)
plt.ylabel('GDP', fontsize = 15)
plt.title('2017');
# Compare against Atlas
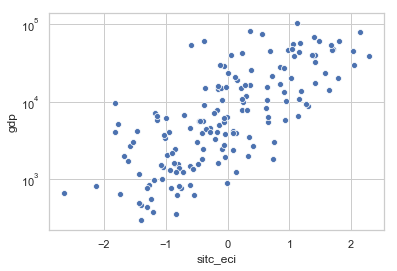
df = cdata[cdata['gdp'] >0]
sns.scatterplot('sitc_eci','gdp', data=df)
plt.yscale('log');
df = pd.read_csv('../data/country_partner_sitcproduct4digit_year_2017.zip',compression="zip", low_memory=False)
len(df)
4672972
df[:3]
| location_id | partner_id | product_id | year | export_value | import_value | sitc_eci | sitc_coi | location_code | location_name_short_en | partner_code | partner_name_short_en | sitc_product_code | sitc_product_name_short_en | |
|---|---|---|---|---|---|---|---|---|---|---|---|---|---|---|
| 0 | 0 | 7 | 696 | 2017 | 0 | 11321 | 0.633293 | -0.044210 | ABW | Aruba | ARE | United Arab Emirates | 0484 | Bakery products |
| 1 | 1 | 7 | 696 | 2017 | 0 | 9772031 | -1.237445 | -0.921007 | AFG | Afghanistan | ARE | United Arab Emirates | 0484 | Bakery products |
| 2 | 2 | 7 | 696 | 2017 | 0 | 1013881 | -1.822037 | -1.232933 | AGO | Angola | ARE | United Arab Emirates | 0484 | Bakery products |
df = df.drop_duplicates()
len(df)
df_year = df.fillna(0)
len(df_year)
4672972
df_gdp = pd.read_csv('./GDP/API_NY.GDP.PCAP.CD_DS2_en_csv_v2_41089.csv', sep = '\t')
year =2017
df_g = df_gdp[['Country Code', str(year)]]
gdp_dict =dict(zip(df_g['Country Code'],df_g[str(year)]))
eci_hidago = df_year[['sitc_eci','location_code']].drop_duplicates()
eci_hidago_dict =dict(zip(eci_hidago['location_code'],eci_hidago['sitc_eci']))
x = list(df_year["location_code"])
y = list(df_year["sitc_product_code"])
data = np.array(list(df_year["export_value"]))
sx = list(set(x))
sy =list(set(y))
dx = dict(zip(sx,range(len(sx))))
dy = dict(zip(sy,range(len(sy))))
x1 = [dx[xi] for xi in x]
y1 = [dy[yi] for yi in y]
len(y1), len(x), len(data)
(470, 4672972, 4672972)
# 构建出口矩阵
M = sparse.csc_matrix((data,(x1,y1)),(len(dx),len(dy)))
M
<235x769 sparse matrix of type '<class 'numpy.int64'>'
	with 154175 stored elements in Compressed Sparse Column format>
#计算RCA
R = RCA_sparse(M)
==Time 0.21==
/Users/datalab/anaconda3/lib/python3.7/site-packages/scipy/sparse/compressed.py:282: SparseEfficiencyWarning: Comparing a sparse matrix with a scalar greater than zero using < is inefficient, try using >= instead.
  warn(bad_scalar_msg, SparseEfficiencyWarning)
R=R.toarray()
R[np.isnan(R)]=0.0
Mat_Dict = Get_eci_pci(np.matrix(R))
eci,pci = Mat_Dict['eci'],Mat_Dict['pci']
==Time 0.51==
#利用稀疏矩阵计算:
Dict = Get_eci_pci_sparse(sparse.csc_matrix(R))
eci_sparse,pci_sparse = Dict['eci'],Dict['pci']
==Time 0.09==
# 利用ecomplexity计算出来的结果
from ecomplexity import ecomplexity
from ecomplexity import proximity
time = [2017]*len(x)
trade_cols = {'time':'year', 'loc':'name', 'prod':'skill', 'val':'value'}
SData=pd.DataFrame({"year":time,'name':x,"skill":y,"value":data})
cdata = ecomplexity(SData, trade_cols)#使用过滤函数
res=pd.DataFrame({'name':list(cdata.name),"eci":list(cdata.eci)})
res = res.drop_duplicates()
/Users/datalab/anaconda3/lib/python3.7/site-packages/ecomplexity/ComplexityData.py:54: UserWarning: Duplicate values exist, keeping the first occurrence
  'Duplicate values exist, keeping the first occurrence')
2017
trade_cols = {'time':'year', 'loc':'location_code', 'prod':'sitc_product_code', 'val':'export_value'}
cdata2 = ecomplexity(df_year, trade_cols)
/Users/datalab/anaconda3/lib/python3.7/site-packages/ecomplexity/ComplexityData.py:54: UserWarning: Duplicate values exist, keeping the first occurrence
  'Duplicate values exist, keeping the first occurrence')
2017
res2=pd.DataFrame({'name':list(cdata2.location_code),"eci":list(cdata2.eci)})
res2 = res2.drop_duplicates()
y =[eci[dx[name]] for name in res.name]
y1 = [eci_sparse[dx[name]] for name in res.name]
y2 = [eci_hidago_dict[name] for name in res.name]
gdp = [gdp_dict[name] if name in gdp_dict else 0.0 for name in res.name]
total=pd.DataFrame({'name':list(res.name),
                    'gdp':gdp,
                    'eci_hidalgo_rep':y2,
                    "eci_ecomplexity_cal":list(res.eci),
                    'eci_mat':y,
                    'eci_sparse':y1})
total.head()
| name | gdp | eci_hidalgo_rep | eci_ecomplexity_cal | eci_mat | eci_sparse | |
|---|---|---|---|---|---|---|
| 0 | ABW | 25630.266490 | 0.633293 | 0.835738 | 0.012386 | 0.012386 |
| 1 | AFG | 556.302138 | -1.237445 | -1.378222 | -1.617771 | -1.617771 |
| 2 | AGO | 4095.812942 | -1.822037 | -1.764049 | -0.796055 | -0.796055 |
| 3 | AIA | 0.000000 | 0.940984 | 1.165619 | 0.277133 | 0.277133 |
| 4 | ALB | 4532.889198 | -0.288839 | -0.688075 | 0.153267 | 0.153267 |
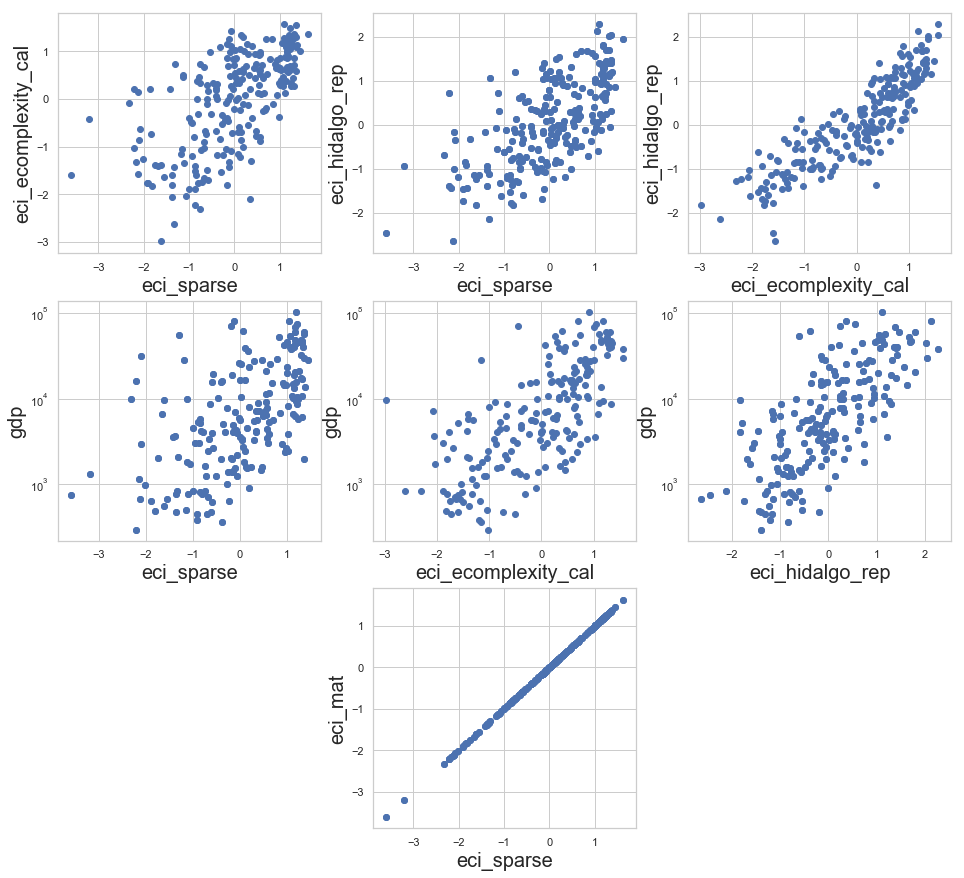
plt.figure(figsize=(16,15))

plt.subplot(338)
plot('eci_sparse', 'eci_mat')
plt.subplot(331)
plot('eci_sparse', 'eci_ecomplexity_cal')
plt.subplot(332)
plot('eci_sparse', 'eci_hidalgo_rep')
plt.subplot(333)
plot('eci_ecomplexity_cal', 'eci_hidalgo_rep')
plt.subplot(334)
plotGDP('eci_sparse', 'gdp')
plt.subplot(335)
plotGDP('eci_ecomplexity_cal', 'gdp')
plt.subplot(336)
plotGDP('eci_hidalgo_rep', 'gdp')
sitc digit-2 data#
df = pd.read_csv('country_sitcproduct2digit_year.csv',low_memory=False)
year =2017
df_year = df[df['year']==year]
df_year = df_year.drop_duplicates()
df_year = df_year.fillna(0)
df_gdp = pd.read_csv('./GDP/API_NY.GDP.PCAP.CD_DS2_en_csv_v2_41089.csv', sep = '\t')
df_g = df_gdp[['Country Code', str(year)]]
gdp_dict =dict(zip(df_g['Country Code'],df_g[str(year)]))
eci_hidago = df_year[['sitc_eci','location_code']].drop_duplicates()
eci_hidago_dict =dict(zip(eci_hidago['location_code'],eci_hidago['sitc_eci']))
x = list(df_year["location_code"])
y = list(df_year["sitc_product_code"])
data = np.array(list(df_year["export_value"]))
sx = list(set(x))
sy =list(set(y))
dx = dict(zip(sx,range(len(sx))))
dy = dict(zip(sy,range(len(sy))))
x1 = [dx[xi] for xi in x]
y1 = [dy[yi] for yi in y]
# 构建出口矩阵
M = sparse.csc_matrix((data,(x1,y1)),(len(dx),len(dy)))
#计算RCA
R = RCA_sparse(M)
==Time 0.03==
/Users/datalab/anaconda3/lib/python3.7/site-packages/scipy/sparse/base.py:597: RuntimeWarning: divide by zero encountered in true_divide
  return np.true_divide(self.todense(), other)
/Users/datalab/anaconda3/lib/python3.7/site-packages/scipy/sparse/base.py:597: RuntimeWarning: invalid value encountered in true_divide
  return np.true_divide(self.todense(), other)
/Users/datalab/anaconda3/lib/python3.7/site-packages/scipy/sparse/compressed.py:208: RuntimeWarning: invalid value encountered in greater_equal
  res = self._with_data(op(self.data, other), copy=True)
/Users/datalab/anaconda3/lib/python3.7/site-packages/scipy/sparse/compressed.py:282: SparseEfficiencyWarning: Comparing a sparse matrix with a scalar greater than zero using < is inefficient, try using >= instead.
  warn(bad_scalar_msg, SparseEfficiencyWarning)
R=R.toarray()
R[np.isnan(R)]=0.0
Mat_Dict = Get_eci_pci(np.matrix(R))
eci,pci = Mat_Dict['eci'],Mat_Dict['pci']
==Time 0.01==
#利用稀疏矩阵计算:
Dict = Get_eci_pci_sparse(sparse.csc_matrix(R))
eci_sparse,pci_sparse = Dict['eci'],Dict['pci']
==Time 0.01==
# 利用ecomplexity计算出来的结果
from ecomplexity import ecomplexity
from ecomplexity import proximity
time = [2017]*len(x)
trade_cols = {'time':'year', 'loc':'name', 'prod':'skill', 'val':'value'}
SData=pd.DataFrame({"year":time,'name':x,"skill":y,"value":data})
cdata = ecomplexity(SData, trade_cols)#使用过滤函数
res=pd.DataFrame({'name':list(cdata.name),"eci":list(cdata.eci)})
res = res.drop_duplicates()
2017
df_year = df[df['year']==year]
trade_cols = {'time':'year', 'loc':'location_code', 'prod':'sitc_product_code', 'val':'export_value'}
cdata2 = ecomplexity(df_year, trade_cols)
2017
res2=pd.DataFrame({'name':list(cdata2.location_code),"eci":list(cdata2.eci)})
res2 = res2.drop_duplicates()
y =[eci[dx[name]] for name in res.name]
y1 = [eci_sparse[dx[name]] for name in res.name]
y2 = [eci_hidago_dict[name] for name in res.name]
gdp = [gdp_dict[name] if name in gdp_dict else 0.0 for name in res.name]
total=pd.DataFrame({'name':list(res.name),
                    'gdp':gdp,
                    'eci_hidalgo_rep':y2,
                    "eci_ecomplexity_cal":list(res.eci),
                    'eci_mat':y,
                    'eci_sparse':y1})
total.head()
| name | gdp | eci_hidalgo_rep | eci_ecomplexity_cal | eci_mat | eci_sparse | |
|---|---|---|---|---|---|---|
| 0 | ABW | 25630.266490 | 0.633293 | -0.428741 | -0.430580 | -0.430580 |
| 1 | AFG | 556.302138 | -1.237445 | -1.080686 | -1.083838 | -1.083838 |
| 2 | AGO | 4095.812942 | -1.822037 | -1.478833 | -1.482787 | -1.482787 |
| 3 | AIA | 0.000000 | 0.940984 | 1.044546 | 1.045672 | 1.045672 |
| 4 | ALB | 4532.889198 | -0.288839 | -0.195837 | -0.197208 | -0.197208 |
import matplotlib.pyplot as plt
import seaborn as sns
plt.figure(figsize=(5,5))
sns.set(style="whitegrid")
#for key in [ "eci_hidalgo_rep","eci_ecomplexity_cal","eci_mat","eci_sparse"]:
<Figure size 360x360 with 0 Axes>
def plot(key1, key2):
    # [ "eci_hidalgo_rep","eci_ecomplexity_cal","eci_mat","eci_sparse"]
    plt.scatter(total[key1], total[key2])
    plt.xlabel(key1,fontsize=20)
    plt.ylabel(key2,fontsize=20)
    #plt.show()

def plotGDP(key1, key2):
    df = total[total['gdp'] >0]
    plt.scatter(df[key1], df[key2])
    plt.xlabel(key1,fontsize=20)
    plt.ylabel(key2,fontsize=20)
    plt.yscale('log')
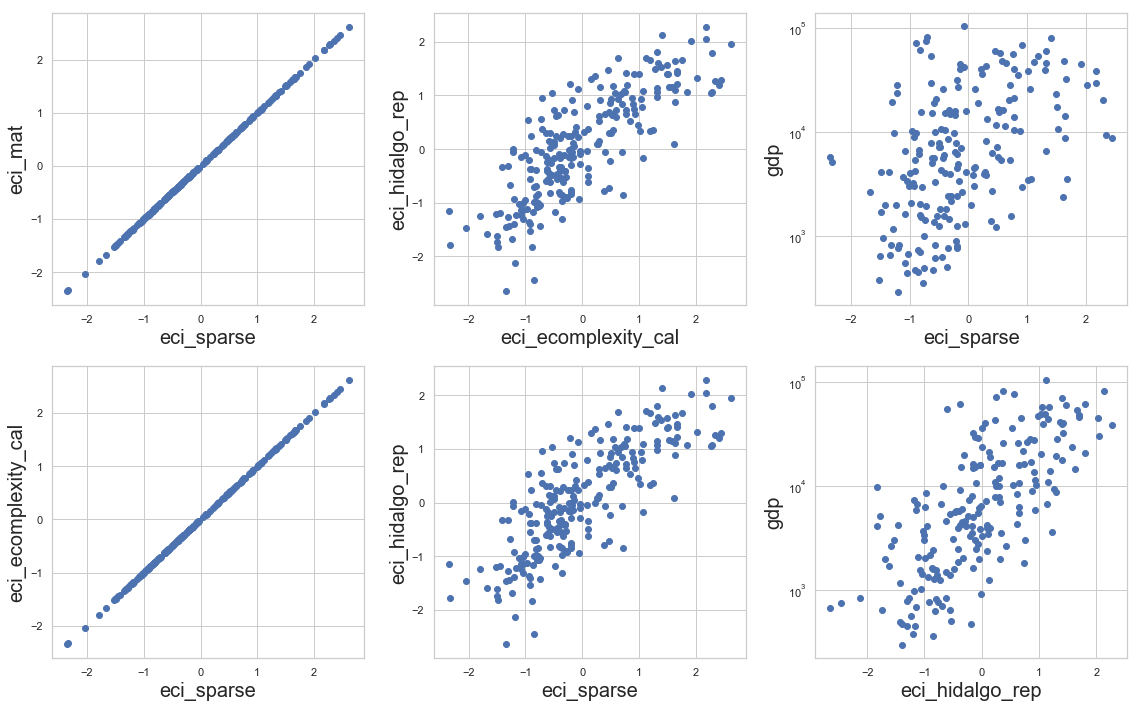
plt.figure(figsize=(16,10))

plt.subplot(231)
plot('eci_sparse', 'eci_mat')
plt.subplot(234)
plot('eci_sparse', 'eci_ecomplexity_cal')
plt.subplot(232)
plot('eci_ecomplexity_cal', 'eci_hidalgo_rep')
plt.subplot(235)
plot('eci_sparse', 'eci_hidalgo_rep')
plt.subplot(233)
plotGDP('eci_sparse', 'gdp')
plt.subplot(236)
plotGDP('eci_hidalgo_rep', 'gdp')
plt.tight_layout()
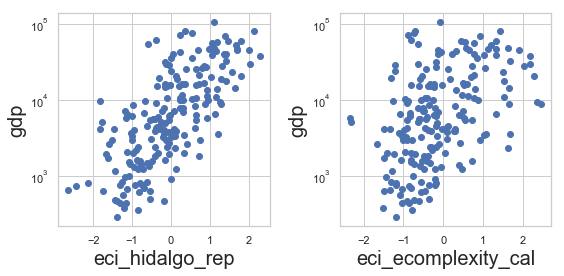
plt.figure(figsize=(8,4))

plt.subplot(121)
plotGDP('eci_hidalgo_rep', 'gdp')
plt.subplot(122)
plotGDP('eci_ecomplexity_cal', 'gdp')
plt.tight_layout()