Logistic Regression of Titanic Data#
Statsmodels#
http://statsmodels.sourceforge.net/

Statsmodels is a Python module that allows users to explore data, estimate statistical models, and perform statistical tests.
An extensive list of descriptive statistics, statistical tests, plotting functions, and result statistics are available for different types of data and each estimator.
Researchers across fields may find that statsmodels fully meets their needs for statistical computing and data analysis in Python.
%matplotlib inline
import matplotlib.pyplot as plt
import pandas as pd
import statsmodels.api as sm
Features include:
Linear regression models
Generalized linear models
Discrete choice models
Robust linear models
Many models and functions for time series analysis
Nonparametric estimators
A collection of datasets for examples
A wide range of statistical tests
Input-output tools for producing tables in a number of formats and for reading Stata files into NumPy and Pandas.
Plotting functions
Extensive unit tests to ensure correctness of results
Many more models and extensions in development
train = pd.read_csv('./data/tatanic_train.csv',sep = ",", header=0)
test = pd.read_csv('./data/tatanic_test.csv',sep = ",", header=0)
Describing Data#
.describe() summarizes the columns/features of the DataFrame, including the count of observations, mean, max and so on.
Another useful trick is to look at the dimensions of the DataFrame. This is done by requesting the .shape attribute of your DataFrame object. (ex. your_data.shape)
train.head()
| Unnamed: 0 | PassengerId | Survived | Pclass | Name | Sex | Age | SibSp | Parch | Ticket | Fare | Cabin | Embarked | |
|---|---|---|---|---|---|---|---|---|---|---|---|---|---|
| 0 | 0 | 1 | 0 | 3 | Braund, Mr. Owen Harris | male | 22.0 | 1 | 0 | A/5 21171 | 7.2500 | NaN | S |
| 1 | 1 | 2 | 1 | 1 | Cumings, Mrs. John Bradley (Florence Briggs Th... | female | 38.0 | 1 | 0 | PC 17599 | 71.2833 | C85 | C |
| 2 | 2 | 3 | 1 | 3 | Heikkinen, Miss. Laina | female | 26.0 | 0 | 0 | STON/O2. 3101282 | 7.9250 | NaN | S |
| 3 | 3 | 4 | 1 | 1 | Futrelle, Mrs. Jacques Heath (Lily May Peel) | female | 35.0 | 1 | 0 | 113803 | 53.1000 | C123 | S |
| 4 | 4 | 5 | 0 | 3 | Allen, Mr. William Henry | male | 35.0 | 0 | 0 | 373450 | 8.0500 | NaN | S |
train.describe()
| Unnamed: 0 | PassengerId | Survived | Pclass | Age | SibSp | Parch | Fare | |
|---|---|---|---|---|---|---|---|---|
| count | 891.000000 | 891.000000 | 891.000000 | 891.000000 | 714.000000 | 891.000000 | 891.000000 | 891.000000 |
| mean | 445.000000 | 446.000000 | 0.383838 | 2.308642 | 29.699118 | 0.523008 | 0.381594 | 32.204208 |
| std | 257.353842 | 257.353842 | 0.486592 | 0.836071 | 14.526497 | 1.102743 | 0.806057 | 49.693429 |
| min | 0.000000 | 1.000000 | 0.000000 | 1.000000 | 0.420000 | 0.000000 | 0.000000 | 0.000000 |
| 25% | 222.500000 | 223.500000 | 0.000000 | 2.000000 | 20.125000 | 0.000000 | 0.000000 | 7.910400 |
| 50% | 445.000000 | 446.000000 | 0.000000 | 3.000000 | 28.000000 | 0.000000 | 0.000000 | 14.454200 |
| 75% | 667.500000 | 668.500000 | 1.000000 | 3.000000 | 38.000000 | 1.000000 | 0.000000 | 31.000000 |
| max | 890.000000 | 891.000000 | 1.000000 | 3.000000 | 80.000000 | 8.000000 | 6.000000 | 512.329200 |
train.shape#, len(train)
#train.columns
(891, 13)
# Passengers that survived vs passengers that passed away
train["Survived"][:3]
0    0
1    1
2    1
Name: Survived, dtype: int64
Value Counts#
以Series形式返回指定列的不同取值的频率
# Passengers that survived vs passengers that passed away
train["Survived"].value_counts()
0    549
1    342
Name: Survived, dtype: int64
# As proportions
train["Survived"].value_counts(normalize = True)
0    0.616162
1    0.383838
Name: Survived, dtype: float64
train['Sex'].value_counts()
male      577
female    314
Name: Sex, dtype: int64
train[train['Sex']=='female'][:3]#[train['Pclass'] == 3]
| Unnamed: 0 | PassengerId | Survived | Pclass | Name | Sex | Age | SibSp | Parch | Ticket | Fare | Cabin | Embarked | |
|---|---|---|---|---|---|---|---|---|---|---|---|---|---|
| 1 | 1 | 2 | 1 | 1 | Cumings, Mrs. John Bradley (Florence Briggs Th... | female | 38.0 | 1 | 0 | PC 17599 | 71.2833 | C85 | C |
| 2 | 2 | 3 | 1 | 3 | Heikkinen, Miss. Laina | female | 26.0 | 0 | 0 | STON/O2. 3101282 | 7.9250 | NaN | S |
| 3 | 3 | 4 | 1 | 1 | Futrelle, Mrs. Jacques Heath (Lily May Peel) | female | 35.0 | 1 | 0 | 113803 | 53.1000 | C123 | S |
# Males that survived vs males that passed away
train[["Survived", 'Fare']][train["Sex"] == 'male'][:3]
| Survived | Fare | |
|---|---|---|
| 0 | 0 | 7.2500 |
| 4 | 0 | 8.0500 |
| 5 | 0 | 8.4583 |
# Males that survived vs males that passed away
train["Survived"][train["Sex"] == 'male'].value_counts()
0    468
1    109
Name: Survived, dtype: int64
# Females that survived vs Females that passed away
train["Survived"][train["Sex"] == 'female'].value_counts()
1    233
0     81
Name: Survived, dtype: int64
# Normalized male survival
train["Survived"][train["Sex"] == 'male'].value_counts(normalize = True)
0    0.811092
1    0.188908
Name: Survived, dtype: float64
# Normalized female survival
train["Survived"][train["Sex"] == 'female'].value_counts(normalize = True)
1    0.742038
0    0.257962
Name: Survived, dtype: float64
# Create the column Child, and indicate whether child or not a child. Print the new column.
train["Child"] = float('NaN')
train.Child[train.Age < 5] = 1
train.Child[train.Age >= 5] = 0
print(train.Child[:3])
0    0.0
1    0.0
2    0.0
Name: Child, dtype: float64
/var/folders/8b/hhnbt0nd4zsg2qhxc28q23w80000gn/T/ipykernel_65699/714207616.py:3: SettingWithCopyWarning:
A value is trying to be set on a copy of a slice from a DataFrame

See the caveats in the documentation: https://pandas.pydata.org/pandas-docs/stable/user_guide/indexing.html#returning-a-view-versus-a-copy
  train.Child[train.Age < 5] = 1
/var/folders/8b/hhnbt0nd4zsg2qhxc28q23w80000gn/T/ipykernel_65699/714207616.py:4: SettingWithCopyWarning:
A value is trying to be set on a copy of a slice from a DataFrame

See the caveats in the documentation: https://pandas.pydata.org/pandas-docs/stable/user_guide/indexing.html#returning-a-view-versus-a-copy
  train.Child[train.Age >= 5] = 0
# Normalized Survival Rates for under 18
train.Survived[train.Child == 1].value_counts(normalize = True)
1    0.675
0    0.325
Name: Survived, dtype: float64
# Normalized Survival Rates for over 18
train.Survived[train.Child == 0].value_counts(normalize = True)
0    0.609792
1    0.390208
Name: Survived, dtype: float64
透视表(pivotTab)#
透视表就是将指定原有DataFrame的列分别作为行索引和列索引,然后对指定的列应用聚集函数(默认情况下式mean函数)。
列联表(crossTab)#
交叉表是用于统计分组频率的特殊透视表
Compute a simple cross tabulation of two (or more) factors. By default computes a frequency table of the factors unless an array of values and an aggregation function are passed.
pd.crosstab(train['Sex'],train['Survived'],margins=True)
| Survived | 0 | 1 | All |
|---|---|---|---|
| Sex | |||
| female | 81 | 233 | 314 |
| male | 468 | 109 | 577 |
| All | 549 | 342 | 891 |
pd.crosstab(train['Sex'],train['Survived'],margins=True, normalize='index')
| Survived | 0 | 1 |
|---|---|---|
| Sex | ||
| female | 0.257962 | 0.742038 |
| male | 0.811092 | 0.188908 |
| All | 0.616162 | 0.383838 |
pd.crosstab(train['Sex'],[train['Survived'], train['Pclass']],margins=True)
| Survived | 0 | 1 | All | ||||
|---|---|---|---|---|---|---|---|
| Pclass | 1 | 2 | 3 | 1 | 2 | 3 | |
| Sex | |||||||
| female | 3 | 6 | 72 | 91 | 70 | 72 | 314 |
| male | 77 | 91 | 300 | 45 | 17 | 47 | 577 |
| All | 80 | 97 | 372 | 136 | 87 | 119 | 891 |
pd.crosstab(train['Sex'],[train['Survived'], train['Pclass']], normalize='index')
| Survived | 0 | 1 | ||||
|---|---|---|---|---|---|---|
| Pclass | 1 | 2 | 3 | 1 | 2 | 3 |
| Sex | ||||||
| female | 0.009554 | 0.019108 | 0.229299 | 0.289809 | 0.222930 | 0.229299 |
| male | 0.133449 | 0.157712 | 0.519931 | 0.077990 | 0.029463 | 0.081456 |
import numpy as np
pd.crosstab(train['Sex'],train['Pclass'], values=train['Survived'], aggfunc=np.average)
| Pclass | 1 | 2 | 3 |
|---|---|---|---|
| Sex | |||
| female | 0.968085 | 0.921053 | 0.500000 |
| male | 0.368852 | 0.157407 | 0.135447 |
pd.crosstab(train['Sex'],train['Pclass'], values=train['Survived'], aggfunc=np.average, margins=True)
| Pclass | 1 | 2 | 3 | All |
|---|---|---|---|---|
| Sex | ||||
| female | 0.968085 | 0.921053 | 0.500000 | 0.742038 |
| male | 0.368852 | 0.157407 | 0.135447 | 0.188908 |
| All | 0.629630 | 0.472826 | 0.242363 | 0.383838 |
train[['Survived','Sex','Pclass']].pivot_table(index=['Sex','Pclass'])
| Survived | ||
|---|---|---|
| Sex | Pclass | |
| female | 1 | 0.968085 |
| 2 | 0.921053 | |
| 3 | 0.500000 | |
| male | 1 | 0.368852 |
| 2 | 0.157407 | |
| 3 | 0.135447 |
train[['Fare','Sex','Pclass']].pivot_table(index=['Sex','Pclass'])
| Fare | ||
|---|---|---|
| Sex | Pclass | |
| female | 1 | 106.125798 |
| 2 | 21.970121 | |
| 3 | 16.118810 | |
| male | 1 | 67.226127 |
| 2 | 19.741782 | |
| 3 | 12.661633 |
age = pd.cut(train['Age'], [0, 18, 80])
train.pivot_table('Survived', ['Sex', age], 'Pclass')
| Pclass | 1 | 2 | 3 | |
|---|---|---|---|---|
| Sex | Age | |||
| female | (0, 18] | 0.909091 | 1.000000 | 0.511628 |
| (18, 80] | 0.972973 | 0.900000 | 0.423729 | |
| male | (0, 18] | 0.800000 | 0.600000 | 0.215686 |
| (18, 80] | 0.375000 | 0.071429 | 0.133663 |
fare = pd.qcut(train['Fare'], 2)
train.pivot_table('Survived', ['Sex', age], [fare, 'Pclass'])
| Fare | (-0.001, 14.454] | (14.454, 512.329] | |||||
|---|---|---|---|---|---|---|---|
| Pclass | 1 | 2 | 3 | 1 | 2 | 3 | |
| Sex | Age | ||||||
| female | (0, 18] | NaN | 1.000000 | 0.714286 | 0.909091 | 1.000000 | 0.318182 |
| (18, 80] | NaN | 0.880000 | 0.444444 | 0.972973 | 0.914286 | 0.391304 | |
| male | (0, 18] | NaN | 0.000000 | 0.260870 | 0.800000 | 0.818182 | 0.178571 |
| (18, 80] | 0.0 | 0.098039 | 0.125000 | 0.391304 | 0.030303 | 0.192308 | |
Logistic Regression#
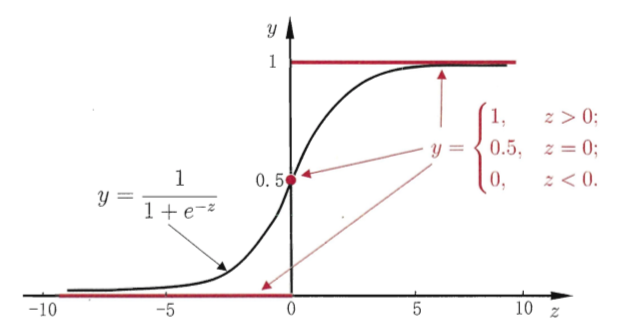
对数几率函数 (一种Sigmoid函数) $\(y = \frac{1}{1+e^{-z}} = \frac{1}{1+e^{-(w^Tx + b)}}\)$
对数几率 log odds $\(logit = ln \frac{y}{1-y} = w^Tx + b\)$
# load data with pandas
import pandas as pd
import statsmodels.api as sm

train = pd.read_csv('./data/tatanic_train.csv',sep = ",", header=0)
Data Cleaning#
# dealing with missing data
train["Age"] = train["Age"].fillna(train["Age"].median())
train["Fare"] = train["Fare"].fillna(train["Fare"].median())
# Convert the male and female groups to integer form
train['Sex'] = train['Sex'].fillna('ffill')
train['female'] = [1 if i =='female' else 0 for i in train['Sex']]
#Impute the Embarked variable
train["Embarked"] = train["Embarked"].fillna('S')
train['embarked_c'] = [1 if i =='C' else 0 for i in train['Embarked']]
train['embarked_q'] = [1 if i =='Q' else 0 for i in train['Embarked']]
logit = sm.Logit(train['Survived'],
                 train[['female', 'Fare', 'Age','Pclass', 'embarked_c', 'embarked_q' ]])
result = logit.fit()
result.summary()
Optimization terminated successfully.
         Current function value: 0.458435
         Iterations 6
| Dep. Variable: | Survived | No. Observations: | 891 |
|---|---|---|---|
| Model: | Logit | Df Residuals: | 885 |
| Method: | MLE | Df Model: | 5 |
| Date: | Fri, 01 Dec 2023 | Pseudo R-squ.: | 0.3116 |
| Time: | 15:28:40 | Log-Likelihood: | -408.47 |
| converged: | True | LL-Null: | -593.33 |
| Covariance Type: | nonrobust | LLR p-value: | 9.902e-78 |
| coef | std err | z | P>|z| | [0.025 | 0.975] | |
|---|---|---|---|---|---|---|
| female | 2.6053 | 0.182 | 14.296 | 0.000 | 2.248 | 2.962 |
| Fare | 0.0041 | 0.002 | 1.973 | 0.049 | 2.66e-05 | 0.008 |
| Age | -0.0113 | 0.005 | -2.216 | 0.027 | -0.021 | -0.001 |
| Pclass | -0.6710 | 0.070 | -9.528 | 0.000 | -0.809 | -0.533 |
| embarked_c | 0.6349 | 0.226 | 2.814 | 0.005 | 0.193 | 1.077 |
| embarked_q | 0.3518 | 0.310 | 1.134 | 0.257 | -0.256 | 0.960 |