可视化Facebook社交网络#
http://snap.stanford.edu/data/ego-Facebook.html
import numpy as np
import pandas as pd
import networkx as nx
import matplotlib.pyplot as plt
%matplotlib inline
import networkx.algorithms.community as nxcom
import random
from numpy import random as nprand
random.seed(123)
nprand.seed(123)

plt.rcParams.update(plt.rcParamsDefault)
plt.rcParams.update({'figure.figsize': (15, 10)})
G_social = nx.read_edgelist('../data/facebook_combined.txt')
nx.info(G_social)
'Name: \nType: Graph\nNumber of nodes: 4039\nNumber of edges: 88234\nAverage degree: 43.6910'
node_size: 指定节点的尺寸大小(默认是300)node_color: 指定节点的颜色 (默认是红色,可以用字符串简单标识颜色,例如’r’为红色,’b’为绿色等)node_shape: 节点的形状(默认是圆形,用字符串’o’标识)alpha: 透明度 (默认是1.0,不透明,0为完全透明)width: 边的宽度 (默认为1.0)edge_color: 边的颜色(默认为黑色)style: 边的样式(默认为实现,可选: solid|dashed|dotted,dashdot)with_labels: 节点是否带标签(默认为True)font_size: 节点标签字体大小 (默认为12)font_color: 节点标签字体颜色(默认为黑色)
plt.style.use('fivethirtyeight')
plt.rcParams['font.family'] = ['sans-serif']
plt.rcParams['font.sans-serif'] = ['SimHei']
def set_node_community(G, communities):
        '''Add community to node attributes'''
        for c, v_c in enumerate(communities):
            for v in v_c:
                # Add 1 to save 0 for external edges
                G.nodes[v]['community'] = c + 1

def set_edge_community(G):
    '''Find internal edges and add their community to their attributes'''
    for v, w, in G.edges:
        if G.nodes[v]['community'] == G.nodes[w]['community']:
            # Internal edge, mark with community
            G.edges[v, w]['community'] = G.nodes[v]['community']
        else:
            # External edge, mark as 0
            G.edges[v, w]['community'] = 0

def get_color(i, r_off=1, g_off=1, b_off=1):
    '''Assign a color to a vertex.'''
    r0, g0, b0 = 0, 0, 0
    n = 16
    low, high = 0.1, 0.9
    span = high - low
    r = low + span * (((i + r_off) * 3) % n) / (n - 1)
    g = low + span * (((i + g_off) * 5) % n) / (n - 1)
    b = low + span * (((i + b_off) * 7) % n) / (n - 1)
    return (r, g, b)
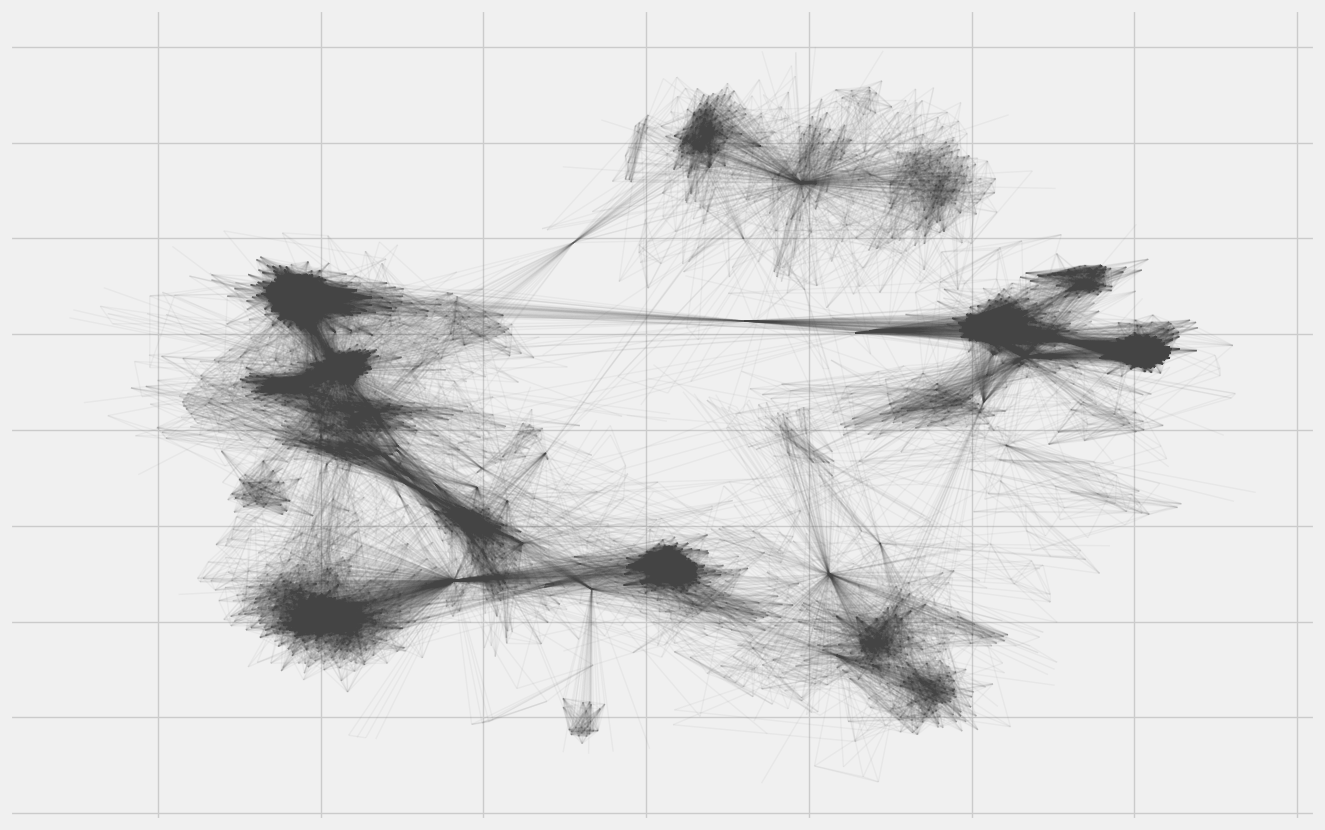
pos = nx.spring_layout(G_social, k=0.1)
plt.rcParams.update({'figure.figsize': (15, 10)})
nx.draw_networkx( G_social, pos=pos, node_size=0, edge_color="#444444", alpha=0.05, with_labels=False)

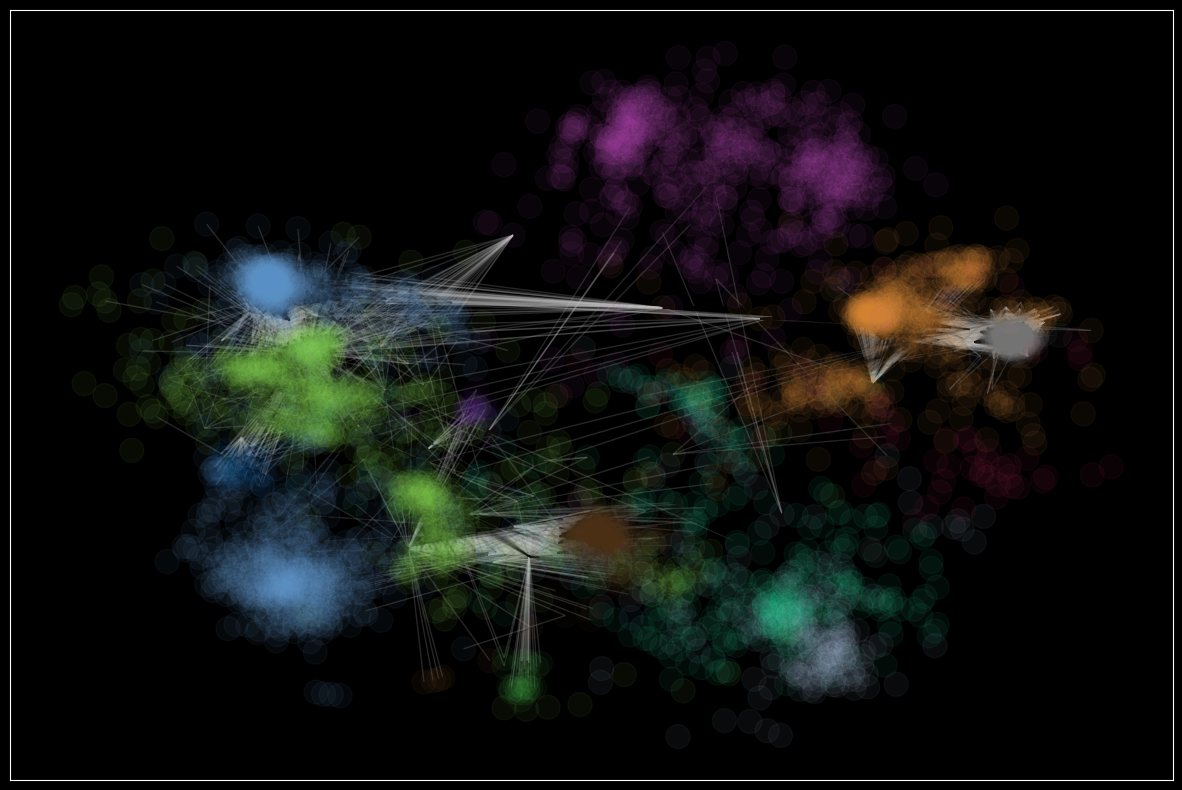
communities = sorted(nxcom.greedy_modularity_communities(G_social), key=len, reverse=True)
len(communities)
13
# PLOT
plt.rcParams.update(plt.rcParamsDefault)
plt.rcParams.update({'figure.figsize': (15, 10)})
plt.style.use('dark_background')

# Set node and edge communities
set_node_community(G_social, communities)
set_edge_community(G_social)

# Set community color for internal edges
external = [(v, w) for v, w in G_social.edges if G_social.edges[v, w]['community'] == 0]
internal = [(v, w) for v, w in G_social.edges if G_social.edges[v, w]['community'] > 0]
internal_color = ["black" for e in internal]
node_color = [get_color(G_social.nodes[v]['community']) for v in G_social.nodes]
# external edges
nx.draw_networkx(
    G_social,
    pos=pos,
    node_size=0,
    edgelist=external,
    edge_color="silver",
    node_color=node_color,
    alpha=0.2,
    with_labels=False)
# internal edges
nx.draw_networkx(
    G_social, pos=pos,
    edgelist=internal,
    edge_color=internal_color,
    node_color=node_color,
    alpha=0.05,
    with_labels=False)

from collections import defaultdict
import numpy as np

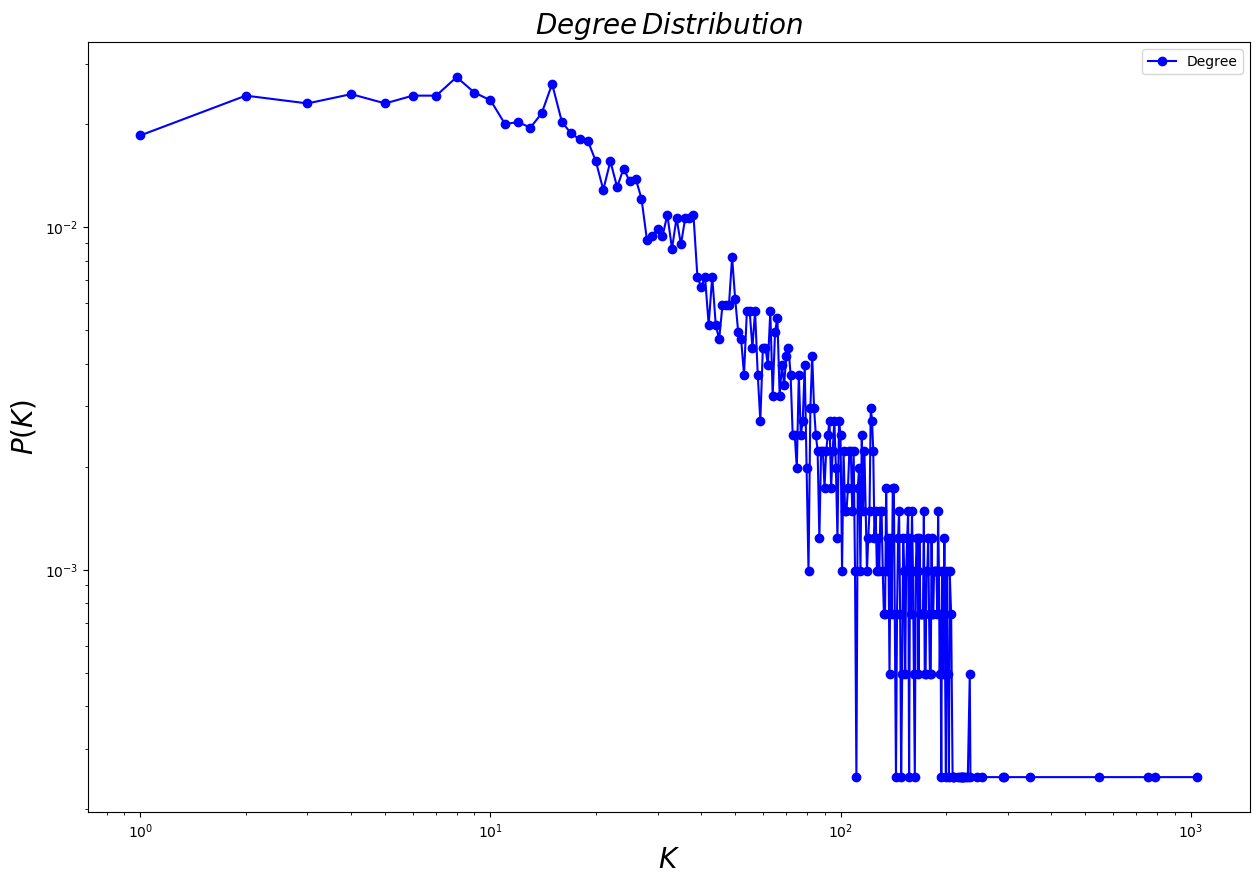
def plotDegreeDistribution(G):
    degs = defaultdict(int)
    for i in dict(G.degree()).values(): degs[i]+=1
    items = sorted ( degs.items () )
    x, y = np.array(items).T
    y_sum = np.sum(y)
    y = [float(i)/y_sum for i in y]
    plt.plot(x, y, 'b-o')
    plt.xscale('log')
    plt.yscale('log')
    plt.legend(['Degree'])
    plt.xlabel('$K$', fontsize = 20)
    plt.ylabel('$P(K)$', fontsize = 20)
    plt.title('$Degree\,Distribution$', fontsize = 20)
    plt.show()
plotDegreeDistribution(G_social)


