Qualitative Colormaps in Matplotlib Visualization#
https://matplotlib.org/stable/tutorials/colors/colormaps.html
Matplotlib has a number of built-in colormaps accessible via matplotlib.cm.get_cmap.
There are also external libraries that have many extra colormaps, which can be viewed in the Third-party colormaps section of the Matplotlib documentation.
import matplotlib.pyplot as plt
import numpy as np
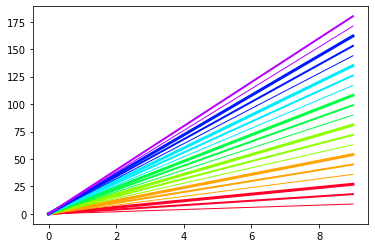
使用for循环逐个添加颜色#
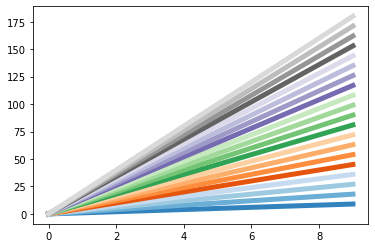
NUM_COLORS = 20

cm = plt.get_cmap('gist_rainbow')
fig = plt.figure()
ax = fig.add_subplot(111)
for i in range(NUM_COLORS):
    lines = ax.plot(np.arange(10)*(i+1))
    lines[0].set_color(cm(i//3*3.0/NUM_COLORS))
    lines[0].set_linewidth(i%3 + 1)

#fig.savefig('moreColors.png')
plt.show()
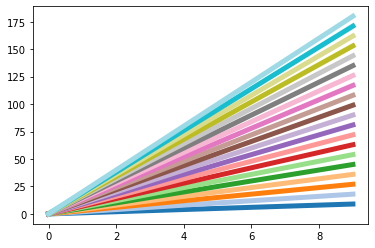
我们会更加推荐使用tab20这一colormap。
NUM_COLORS = 20
cm = plt.get_cmap('tab20')

fig = plt.figure()
ax = fig.add_subplot(111)
for i in range(NUM_COLORS):
    lines = ax.plot(np.arange(10)*(i+1))
    lines[0].set_color(cm(i))
    lines[0].set_linewidth(5)

#fig.savefig('moreColors.png')
plt.show()
cm
tab20

under
bad
over
NUM_COLORS = 20
cm = plt.get_cmap('tab20b')

fig = plt.figure()
ax = fig.add_subplot(111)
for i in range(NUM_COLORS):
    lines = ax.plot(np.arange(10)*(i+1))
    lines[0].set_color(cm(i))
    lines[0].set_linewidth(5)

#fig.savefig('moreColors.png')
plt.show()
cm
tab20b

under
bad
over
NUM_COLORS = 20
cm = plt.get_cmap('tab20c')

fig = plt.figure()
ax = fig.add_subplot(111)
for i in range(NUM_COLORS):
    lines = ax.plot(np.arange(10)*(i+1))
    lines[0].set_color(cm(i))
    lines[0].set_linewidth(5)

#fig.savefig('moreColors.png')
plt.show()
cm
tab20c

under
bad
over
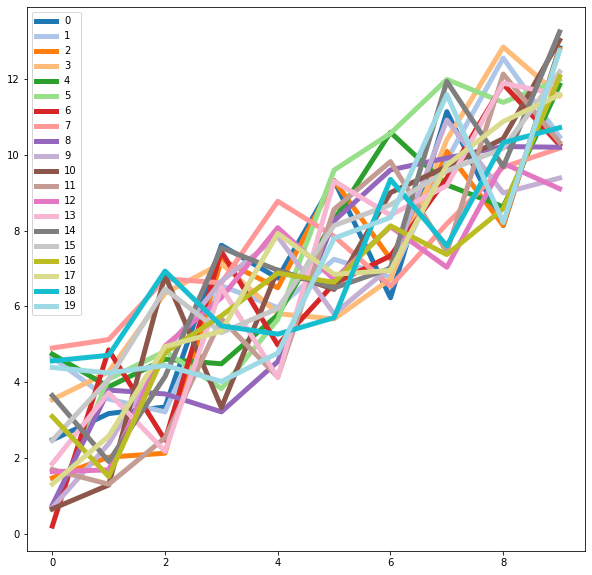
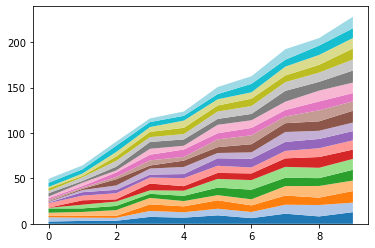
从ColorMap中选择N个颜色#
# Create data
X = np.arange(0, 10, 1)
Y = X + 5 * np.random.random((20, X.size))

cm = plt.get_cmap('tab20')
plt.stackplot(X, Y, colors = cm.colors[:len(Y)]);
cm = plt.get_cmap('tab20')

plt.figure(figsize = [10, 10])
for k, i in enumerate(Y):
    plt.plot(X, i, color = cm(k), linewidth = 5, label = str(k))
plt.legend()
plt.show()