案例:2009年英国国会议员开支丑闻#
MPs expenses scandal
data-journalism/data-journalism.github.io#54
import pandas as pd

import pylab as plt

plt.rcParams['font.sans-serif'] = ['Microsoft YaHei']  # 用来正常显示中文标签
plt.rcParams['axes.unicode_minus'] = False  # 用来正常显示负号, 注意['SimHei']对应这句不行.
plt.style.use('ggplot')
ls './data/'
MPs' expenses claims, Jul-Dec, 2009.xlsx
data.js*
df = pd.read_excel("./data/MPs' expenses claims, Jul-Dec, 2009.xlsx")
df.head()
| Name of member | Allowance Type | Expenditure Type | Date | Amount, £ | |
|---|---|---|---|---|---|
| 0 | Adam Afriyie | Office running costs (IEP/AOE) | Incidentals | 2009-07-03 00:00:00 | 111.09 |
| 1 | Adam Afriyie | Office running costs (IEP/AOE) | Incidentals | 2009-11-05 00:00:00 | 111.09 |
| 2 | Adam Afriyie | Office running costs (IEP/AOE) | Incidentals | 2009-11-05 00:00:00 | 51.75 |
| 3 | Adam Holloway | Communications Expenditure | Delivery charges | 2009-11-10 00:00:00 | 258.22 |
| 4 | Adam Holloway | Communications Expenditure | Delivery charges | 2009-12-10 00:00:00 | 879.66 |
df.columns
Index(['Name of member', 'Allowance Type', 'Expenditure Type', 'Date',
       'Amount, £'],
      dtype='object')
len(df)
38925
df.describe()
| Name of member | Allowance Type | Expenditure Type | Date | Amount, £ | |
|---|---|---|---|---|---|
| count | 38925 | 38925 | 38925 | 38925 | 38925 |
| unique | 643 | 5 | 39 | 140 | 14441 |
| top | Danny Alexander | Office running costs (IEP/AOE) | Incidentals | 2009-12-21 00:00:00 | 50 |
| freq | 173 | 25787 | 8672 | 828 | 857 |
清洗数据#
df[df['Amount, £']=='Amount']
| Name of member | Allowance Type | Expenditure Type | Date | Amount, £ | |
|---|---|---|---|---|---|
| 27710 | Member Name | Allowance Type | Expenditure Type | Date | Amount |
df = df[df['Amount, £']!='Amount']
df[df['Name of member']=='John Randall']
| Name of member | Allowance Type | Expenditure Type | Date | Amount, £ | |
|---|---|---|---|---|---|
| 22221 | John Randall | Office running costs (IEP/AOE) | Accommodation costs | 2009-08-20 00:00:00 | -2134 |
| 22222 | John Randall | Office running costs (IEP/AOE) | Other equipment lease | 2009-07-01 00:00:00 | 25.08 |
df['Amount, £'] = [abs(float(i)) for i in df['Amount, £']]
描述数据#
df[['Name of member', 'Amount, £']].groupby("Name of member").agg('sum')
| Amount, £ | |
|---|---|
| Name of member | |
| Adam Afriyie | 273.93 |
| Adam Holloway | 7415.06 |
| Adam Ingram | 18578.90 |
| Adam Price | 7874.73 |
| Adrian Bailey | 10668.61 |
| ... | ... |
| William Hague | 7370.98 |
| William McCrea | 24689.34 |
| William Rennie | 27257.33 |
| Willie Bain | 822 |
| Yvette Cooper | 21450.30 |
643 rows × 1 columns
dat1 = df[['Name of member', 'Amount, £']].groupby("Name of member").agg('sum')
dat1 = dat1.sort_values(by=['Amount, £'], ascending = False)
dat1[:10]
| Amount, £ | |
|---|---|
| Name of member | |
| Graham Allen | 42753.53 |
| Michael Foster | 39999.69 |
| Mark Hunter | 34779.11 |
| Gordon Banks | 34471.90 |
| Lynda Waltho | 34288.55 |
| Joan Humble | 33395.89 |
| Phil Wilson | 33031.23 |
| Barbara Follett | 32861.14 |
| Sian James | 32495.32 |
| Helen Jones | 32209.45 |
dat1['Rank'] = range(1, len(dat1)+1)
dat1[:10]
| Amount, £ | Rank | |
|---|---|---|
| Name of member | ||
| Graham Allen | 42753.53 | 1 |
| Michael Foster | 39999.69 | 2 |
| Mark Hunter | 34779.11 | 3 |
| Gordon Banks | 34471.90 | 4 |
| Lynda Waltho | 34288.55 | 5 |
| Joan Humble | 33395.89 | 6 |
| Phil Wilson | 33031.23 | 7 |
| Barbara Follett | 32861.14 | 8 |
| Sian James | 32495.32 | 9 |
| Helen Jones | 32209.45 | 10 |
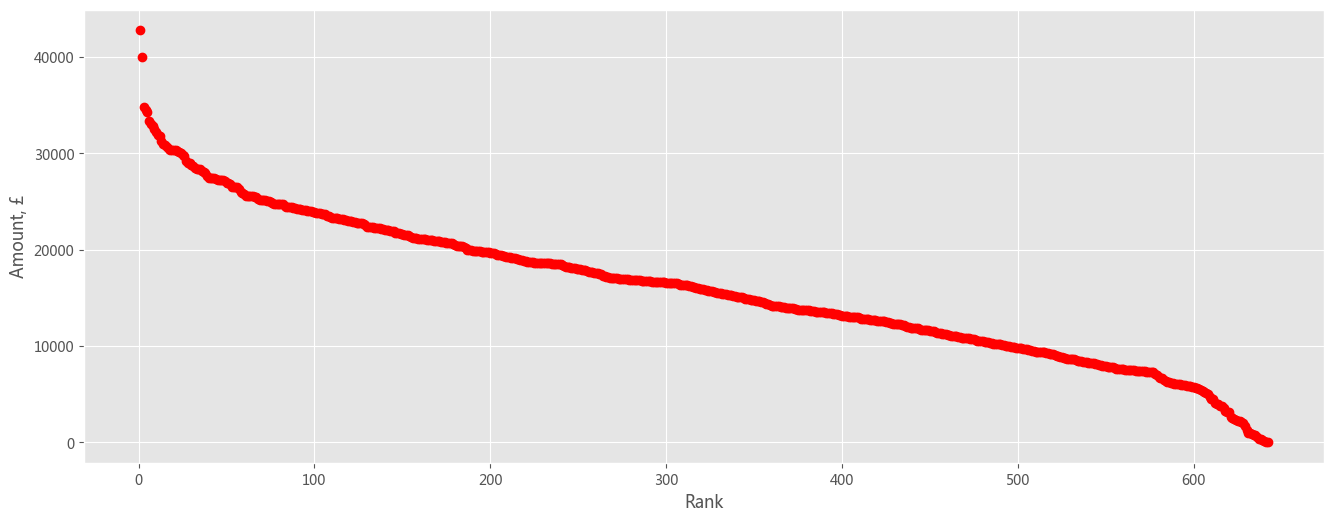
plt.figure(figsize =(16, 6), dpi = 100)

plt.plot(dat1['Rank'], dat1['Amount, £'], 'ro')
# plt.yscale('log')
# plt.xscale('log')

plt.xlabel('Rank')
plt.ylabel('Amount, £')
plt.show()

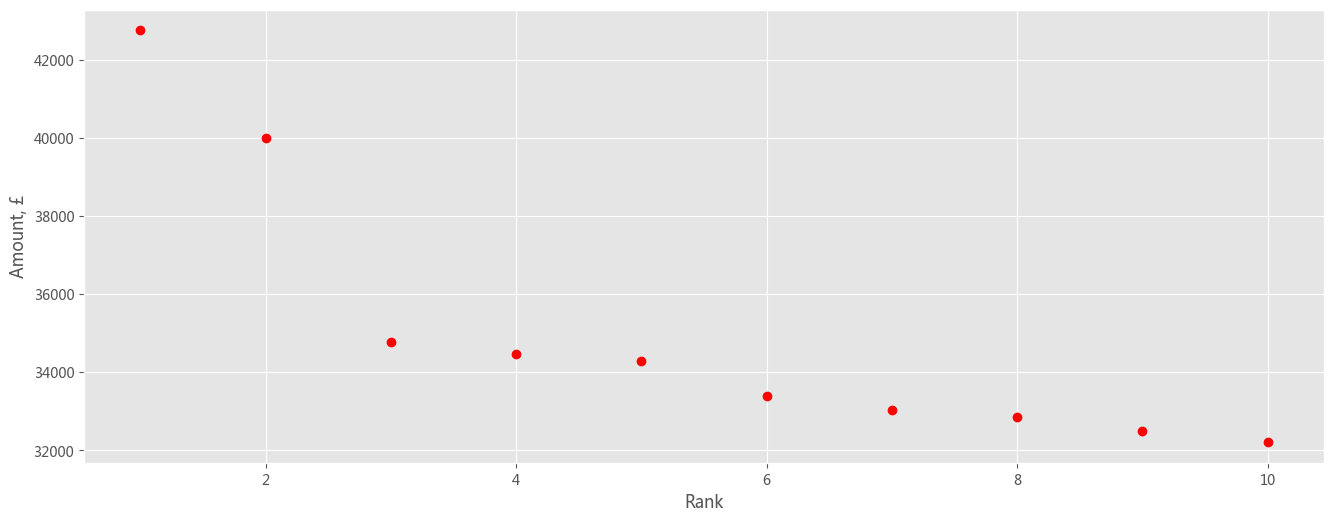
plt.figure(figsize =(16, 6), dpi = 100)

dat10 = dat1[:10]
plt.plot(dat10['Rank'], dat10['Amount, £'], 'ro')
# plt.yscale('log')
# plt.xscale('log')

plt.xlabel('Rank')
plt.ylabel('Amount, £')
plt.show()

dat2 = df[['Allowance Type', 'Amount, £']].groupby("Allowance Type").agg('sum')
dat2 = dat2.sort_values(by=['Amount, £'], ascending = False)
dat2
| Amount, £ | |
|---|---|
| Allowance Type | |
| Office running costs (IEP/AOE) | 4561001.11 |
| Cost of staying away from the main home (ACA/PAAE) | 3160432.72 |
| Communications Expenditure | 2510511.02 |
| Staffing non-payroll | 24414.17 |
dat3 = df[['Expenditure Type', 'Amount, £']].groupby("Expenditure Type").agg('sum')
dat3 = dat3.sort_values(by=['Amount, £'], ascending = False)
dat3
| Amount, £ | |
|---|---|
| Expenditure Type | |
| Accommodation costs | 1809184.32 |
| Publications | 1097722.44 |
| Mortgage interest | 1056568.92 |
| Delivery charges | 1019891.50 |
| Rent | 969231.40 |
| Incidentals | 806222.41 |
| Telephones | 677887.23 |
| Other household costs | 463874.76 |
| Subsistence | 373680.38 |
| Advertising | 261207.10 |
| Council tax | 226974.67 |
| Agencies etc | 220883.47 |
| Constituency Association payments | 187676.45 |
| Utilities | 172737.37 |
| Other equipment lease | 141508.52 |
| Websites | 131689.98 |
| IT equipment purchase | 117466.40 |
| Professional fees | 90381.10 |
| Other equipment purchase | 82802.68 |
| Maintenance, janitorial | 79518.88 |
| Hotel Expenses | 70102.59 |
| Petty cash | 47442.51 |
| Payments to individuals | 42585.55 |
| Member travel (AOE) | 31841.92 |
| Staff Subsistence | 24401.87 |
| Staff office purchases | 22137.03 |
| Staff travel rail | 8195.26 |
| Staff telephone expenses | 6965.79 |
| IT equipment lease | 4382.88 |
| Staff subsistence | 4071.69 |
| Staff travel car | 2888.88 |
| Staff use of home expenses | 1969.68 |
| Staff travel air | 800.41 |
| Staff travel parking | 697.74 |
| Staff travel taxi | 521.54 |
| Staff travel public transport | 190.85 |
| General Running Costs | 40.55 |
| Staff travel tolls | 12.30 |
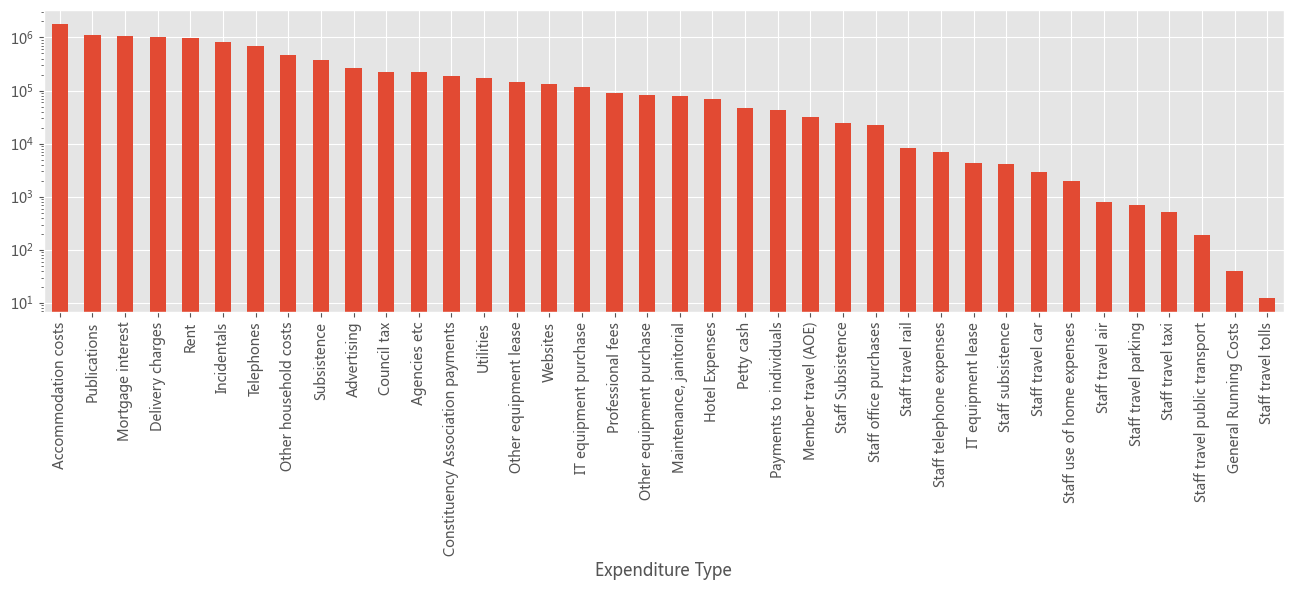
plt.figure(figsize =(16, 4), dpi = 100)
dat3['Amount, £'].plot(kind = 'bar')
plt.yscale('log')
plt.show()

桑基图#
from pyecharts import options as opts
from pyecharts.charts import Sankey

nodes = [
    {"name": "category1"},
    {"name": "category2"},
    {"name": "category3"},
    {"name": "category4"},
    {"name": "category5"},
    {"name": "category6"},
]

links = [
    {"source": "category1", "target": "category2", "value": 10},
    {"source": "category2", "target": "category3", "value": 15},
    {"source": "category3", "target": "category4", "value": 20},
    {"source": "category5", "target": "category6", "value": 25},
]
c = (
    Sankey()
    .add(
        "sankey",
        nodes,
        links,
        linestyle_opt=opts.LineStyleOpts(opacity=0.2, curve=0.5, color="source"),
        label_opts=opts.LabelOpts(position="right"),
    )
    .set_global_opts(title_opts=opts.TitleOpts(title="Sankey-基本示例"))
    #.render("sankey_base.html")
    .render_notebook()
)

c
dat4 = df[['Allowance Type','Expenditure Type', 'Amount, £']].groupby(['Expenditure Type', 'Allowance Type'],  as_index = False).agg('sum')
dat4 = dat4.sort_values(by=['Amount, £'], ascending = False)
dat4
| Expenditure Type | Allowance Type | Amount, £ | |
|---|---|---|---|
| 0 | Accommodation costs | Office running costs (IEP/AOE) | 1809184.32 |
| 20 | Publications | Communications Expenditure | 1097722.44 |
| 13 | Mortgage interest | Cost of staying away from the main home (ACA/P... | 1056568.92 |
| 5 | Delivery charges | Communications Expenditure | 1019891.50 |
| 21 | Rent | Cost of staying away from the main home (ACA/P... | 969231.40 |
| 10 | Incidentals | Office running costs (IEP/AOE) | 806222.41 |
| 35 | Telephones | Office running costs (IEP/AOE) | 677887.23 |
| 16 | Other household costs | Cost of staying away from the main home (ACA/P... | 463874.76 |
| 34 | Subsistence | Cost of staying away from the main home (ACA/P... | 373680.38 |
| 1 | Advertising | Communications Expenditure | 261207.10 |
| 4 | Council tax | Cost of staying away from the main home (ACA/P... | 226974.67 |
| 2 | Agencies etc | Office running costs (IEP/AOE) | 220883.47 |
| 3 | Constituency Association payments | Office running costs (IEP/AOE) | 187676.45 |
| 36 | Utilities | Office running costs (IEP/AOE) | 172737.37 |
| 14 | Other equipment lease | Office running costs (IEP/AOE) | 141508.52 |
| 37 | Websites | Communications Expenditure | 131689.98 |
| 9 | IT equipment purchase | Office running costs (IEP/AOE) | 117466.40 |
| 19 | Professional fees | Office running costs (IEP/AOE) | 90381.10 |
| 15 | Other equipment purchase | Office running costs (IEP/AOE) | 82802.68 |
| 11 | Maintenance, janitorial | Office running costs (IEP/AOE) | 79518.88 |
| 7 | Hotel Expenses | Cost of staying away from the main home (ACA/P... | 70102.59 |
| 18 | Petty cash | Office running costs (IEP/AOE) | 47442.51 |
| 17 | Payments to individuals | Office running costs (IEP/AOE) | 42585.55 |
| 12 | Member travel (AOE) | Office running costs (IEP/AOE) | 31841.92 |
| 22 | Staff Subsistence | Staffing non-payroll | 24401.87 |
| 23 | Staff office purchases | Office running costs (IEP/AOE) | 22137.03 |
| 30 | Staff travel rail | Office running costs (IEP/AOE) | 8195.26 |
| 25 | Staff telephone expenses | Office running costs (IEP/AOE) | 6965.79 |
| 8 | IT equipment lease | Office running costs (IEP/AOE) | 4382.88 |
| 24 | Staff subsistence | Office running costs (IEP/AOE) | 4071.69 |
| 27 | Staff travel car | Office running costs (IEP/AOE) | 2888.88 |
| 33 | Staff use of home expenses | Office running costs (IEP/AOE) | 1969.68 |
| 26 | Staff travel air | Office running costs (IEP/AOE) | 800.41 |
| 28 | Staff travel parking | Office running costs (IEP/AOE) | 697.74 |
| 31 | Staff travel taxi | Office running costs (IEP/AOE) | 521.54 |
| 29 | Staff travel public transport | Office running costs (IEP/AOE) | 190.85 |
| 6 | General Running Costs | Office running costs (IEP/AOE) | 40.55 |
| 32 | Staff travel tolls | Staffing non-payroll | 12.30 |
nodes = dat4['Allowance Type'].unique().tolist() + dat4['Expenditure Type'].unique().tolist()
nodes = [{'name': i} for i in nodes]
links = [{'source': dat4['Allowance Type'][i], 'target': dat4['Expenditure Type'][i], 'value': dat4['Amount, £'][i]}  for i in dat4.index]
from pyecharts import options as opts
from pyecharts.charts import Sankey

s = (
    Sankey()
    .add(
        "sankey",
        nodes,
        links,
        linestyle_opt=opts.LineStyleOpts(opacity=0.2, curve=0.5, color="source"),
        label_opts=opts.LabelOpts(position="right"),
    )
    .set_global_opts(title_opts=opts.TitleOpts(title="Sankey Graph of UK MPS"))
)

s.render_notebook()
s.render("sankey_mps.html")
'/Users/datalab/github/data-journalism.github.io/notebook/sankey_mps.html'

