第十一章 可视化#
Visualization with Seaborn#
Seaborn is a Python data visualization library based on matplotlib.
It provides a high-level interface for drawing attractive and informative statistical graphics.
it integrates with the functionality provided by Pandas DataFrames.
%matplotlib inline

import numpy as np; np.random.seed(22)
import seaborn as sns;
import pylab as plt
To be fair, the Matplotlib team is addressing this:
it has recently added the plt.style tools,
is starting to handle Pandas data more seamlessly.
Matplotlib Styles#
plt.style.available
['seaborn-dark',
 'seaborn-darkgrid',
 'seaborn-ticks',
 'fivethirtyeight',
 'seaborn-whitegrid',
 'classic',
 '_classic_test',
 'fast',
 'seaborn-talk',
 'seaborn-dark-palette',
 'seaborn-bright',
 'seaborn-pastel',
 'grayscale',
 'seaborn-notebook',
 'ggplot',
 'seaborn-colorblind',
 'seaborn-muted',
 'seaborn',
 'Solarize_Light2',
 'seaborn-paper',
 'bmh',
 'tableau-colorblind10',
 'seaborn-white',
 'dark_background',
 'seaborn-poster',
 'seaborn-deep']
The basic way to switch to a stylesheet is to call
plt.style.use('stylename')
But keep in mind that this will change the style for the rest of the session! Alternatively, you can use the style context manager, which sets a style temporarily:
with plt.style.context('stylename'):
    make_a_plot()
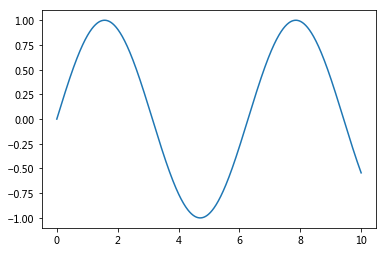
x = np.linspace(0, 10, 1000)
plt.plot(x, np.sin(x));
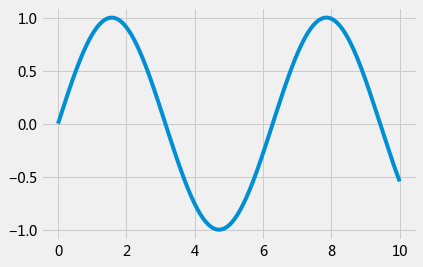
plt.style.use('fivethirtyeight')
x = np.linspace(0, 10, 1000)
plt.plot(x, np.sin(x));
Seaborn Datasets#
sns.get_dataset_names()
/Users/datalab/anaconda3/lib/python3.7/site-packages/seaborn/utils.py:376: UserWarning: No parser was explicitly specified, so I'm using the best available HTML parser for this system ("lxml"). This usually isn't a problem, but if you run this code on another system, or in a different virtual environment, it may use a different parser and behave differently.

The code that caused this warning is on line 376 of the file /Users/datalab/anaconda3/lib/python3.7/site-packages/seaborn/utils.py. To get rid of this warning, pass the additional argument 'features="lxml"' to the BeautifulSoup constructor.

  gh_list = BeautifulSoup(http)
['anscombe',
 'attention',
 'brain_networks',
 'car_crashes',
 'diamonds',
 'dots',
 'exercise',
 'flights',
 'fmri',
 'gammas',
 'iris',
 'mpg',
 'planets',
 'tips',
 'titanic']
lineplot#
fmri = sns.load_dataset("fmri")
fmri.head()
| subject | timepoint | event | region | signal | |
|---|---|---|---|---|---|
| 0 | s13 | 18.0 | stim | parietal | -0.017552 |
| 1 | s5 | 14.0 | stim | parietal | -0.080883 |
| 2 | s12 | 18.0 | stim | parietal | -0.081033 |
| 3 | s11 | 18.0 | stim | parietal | -0.046134 |
| 4 | s10 | 18.0 | stim | parietal | -0.037970 |
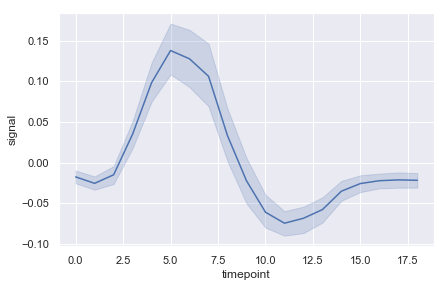
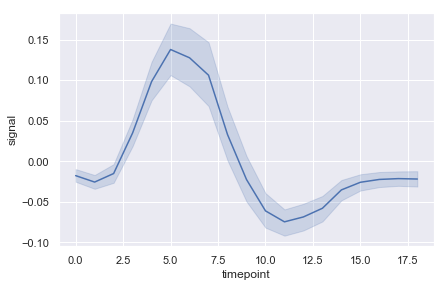
ax = sns.lineplot(x="timepoint", y="signal", err_style="band",data=fmri)
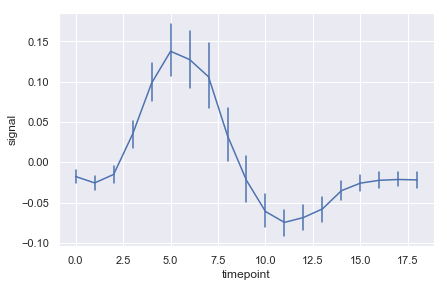
ax = sns.lineplot(x="timepoint", y="signal", err_style="bars",data=fmri)
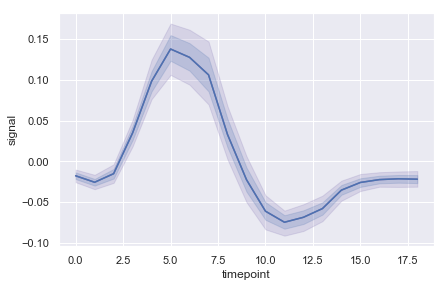
ax = sns.lineplot(x="timepoint", y="signal", ci=95, color="m",data=fmri)
ax = sns.lineplot(x="timepoint", y="signal", ci=68, color="b",data=fmri)
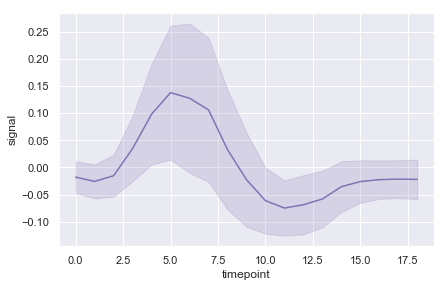
ax = sns.lineplot(x="timepoint", y="signal", ci='sd', color="m",data=fmri)
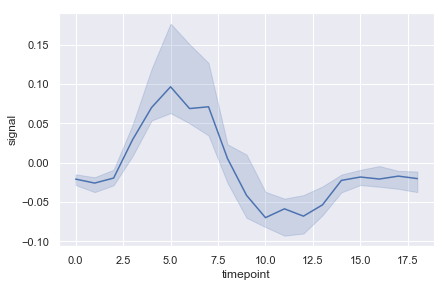
ax = sns.lineplot(x="timepoint", y="signal", estimator=np.median, data=fmri)
#ax = sns.tsplot(data=data, err_style="boot_traces", n_boot=500)
ax = sns.lineplot(x="timepoint", y="signal", err_style="band", n_boot=500, data=fmri)
http://seaborn.pydata.org/generated/seaborn.barplot.html#seaborn.barplot
Bar Plot#
import seaborn as sns;
sns.set(color_codes=True)
tips = sns.load_dataset("tips")
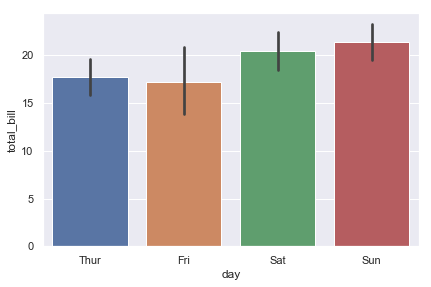
ax = sns.barplot(x="day", y="total_bill", data=tips)
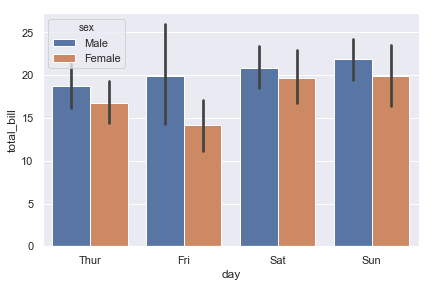
ax = sns.barplot(x="day", y="total_bill", hue="sex", data=tips)
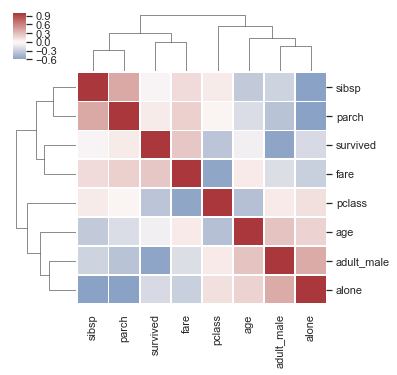
Clustermap#
Discovering structure in heatmap data
http://seaborn.pydata.org/examples/structured_heatmap.html
df = sns.load_dataset("titanic")
df.corr()
| survived | pclass | age | sibsp | parch | fare | adult_male | alone | |
|---|---|---|---|---|---|---|---|---|
| survived | 1.000000 | -0.338481 | -0.077221 | -0.035322 | 0.081629 | 0.257307 | -0.557080 | -0.203367 |
| pclass | -0.338481 | 1.000000 | -0.369226 | 0.083081 | 0.018443 | -0.549500 | 0.094035 | 0.135207 |
| age | -0.077221 | -0.369226 | 1.000000 | -0.308247 | -0.189119 | 0.096067 | 0.280328 | 0.198270 |
| sibsp | -0.035322 | 0.083081 | -0.308247 | 1.000000 | 0.414838 | 0.159651 | -0.253586 | -0.584471 |
| parch | 0.081629 | 0.018443 | -0.189119 | 0.414838 | 1.000000 | 0.216225 | -0.349943 | -0.583398 |
| fare | 0.257307 | -0.549500 | 0.096067 | 0.159651 | 0.216225 | 1.000000 | -0.182024 | -0.271832 |
| adult_male | -0.557080 | 0.094035 | 0.280328 | -0.253586 | -0.349943 | -0.182024 | 1.000000 | 0.404744 |
| alone | -0.203367 | 0.135207 | 0.198270 | -0.584471 | -0.583398 | -0.271832 | 0.404744 | 1.000000 |
# Draw the full plot
ax = sns.clustermap(df.corr(), center=0, cmap="vlag",
               #row_colors=network_colors, col_colors=network_colors,
               linewidths=.75, figsize=(5, 5))
