Jupyter Notebook#
It is a web application that allows you to create and share documents that contain
live code
equations
visualizations
explanatory text
Table of Contents
Copy and Paste images#

Set the layout of figures#
first copy and paste a figure into notebook, and you will get this line of script:

Second, replace it with the following script:
<div>
<img src="attachment:image.png"
     align="right" width = "200px"/>
</div>
<div>
<img src="attachment:image.png" align="right" width = "200px"/>
</div>
“Know thyself.” ― Socrates
“The unexamined life is not worth living.” ― Socrates
“Wonder is the beginning of wisdom.” ― Socrates
“True wisdom comes to each of us when we realize how little we understand about life, ourselves, and the world around us.” ― Socrates
Publish on Github Pages#
Confirm that your book’s HTML is built in the _site folder.
Install the ghp-import tool.
pip install ghp-import
Use ghp-import to push your book’s HTML onto the gh-pages branch of your repository.
ghp-import -n -p -f _site
Workflow#
#!/bin/bash
# open github master branch
# open atom master branch
cd ..
jupyter-book build ccbook/
cd ccbook
make serve

# Publish your book's HTML manually to GitHub-pages
# publish the _site folder of master
# branch to gh-pages branch

ghp-import -n -p -f _site
# my first python script
print("Hello world!\nI am Cheng-Jun Wang.")
Hello world!
I am Cheng-Jun Wang.
Uses include:
data cleaning and transformation,
numerical simulation,
statistical modeling,
machine learning
and much more.
print('hello world')
hello world
1 + 1
2
\(E = MC^2\)
引用#
Because jupyter-book is built on top of Jekyll, we can use the excellent jekyll-scholar plugin to include citations and a bibliography with your book.
Note: It only works if you’re building your book HTML locally and hosting the HTML files online somewhere.
{% cite holdgraf_evidence_2014 %}
For example, this text: {% cite holdgraf_evidence_2014 %} generates this citation:
https://jupyterbook.org/features/citations.html
# 一级标题
## 二级标题

[南京大学](http://www.fdu.edu.cn)是一个*非常棒*的大学!

1. point 1
1. point 2
1. point 3
Here’s an example of an epigraph quote. Note that in this case, the quote itself is a bit larger and italicized. You probably shouldn’t make this too long so that they don’t stand out too much. - Jo the Jovyan
For example, here’s some popout content! It was created by adding the popout tag to a cell in the notebook. Jupyter Book automatically converts these cells into helpful side content.
To enable the cell tag editor, go click View -> Cell Toolbar -> Tags. This will enable the tags UI. Here’s what the menu looks like.
搜狗输入法表情和符号#
∫ ∑ ※ ➕➖✖️➗ ❎ √ ×
😪😠😡😎☺️😁📚🌲
👌👍👎👂👃👀✋❌💰🌂
0️⃣1️⃣2️⃣3️⃣4️⃣5️⃣6️⃣7️⃣8️⃣9️⃣②🔟
🐶🐱🐔🐷🐖🐴🐎🐂🐑🐯🐧🐺🐒🐵🐻🐦🐲
💻 🌈🌎☁️❄️🏃♀👩👱✨
🆚🔥🌹✈️🌉🎄
(✿◡‿◡)害羞 ⁄(⁄ ⁄•⁄ω⁄•⁄ ⁄)⁄ d=====( ̄▽ ̄*)b厉害
我是我,不一样花火。~( ̄▽ ̄~)(~ ̄▽ ̄)~ 矜持
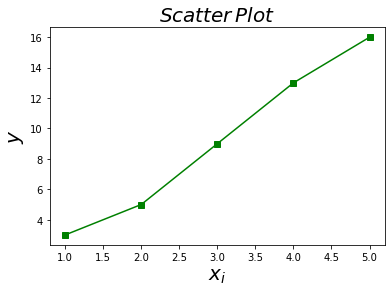
%matplotlib inline
import matplotlib.pyplot as plt

xi = [1, 2, 3, 4, 5]
y = [3, 5, 9, 13, 16]

plt.plot(xi, y, 'g-s')
plt.xlabel('$x_i$', fontsize = 20)
plt.ylabel('$y$', fontsize = 20)
plt.title('$Scatter\,Plot$', fontsize = 20)
plt.show()

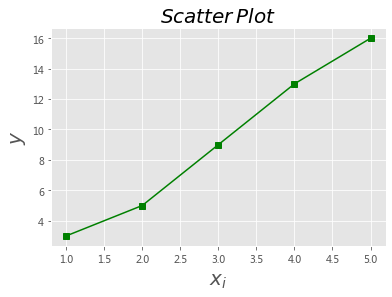
import matplotlib.pyplot as plt
plt.style.use('ggplot')
xi = [1, 2, 3, 4, 5]
y = [3, 5, 9, 13, 16]
plt.plot(xi, y, 'g-s')
plt.xlabel('$x_i$', fontsize = 20)
plt.ylabel('$y$', fontsize = 20)
plt.title('$Scatter\,Plot$', fontsize = 20)
plt.show()

运行C代码#
C functions are typically split into header files (.h) where things are declared but not defined, and implementation files (.c) where they are defined. http://people.duke.edu/~ccc14/sta-663/CrashCourseInC.html#a-tutorial-example-coding-a-fibonacci-function-in-c
%%file hello.c
#include <stdio.h>

int main() {
    printf("Hello, world!");
}
Overwriting hello.c
! gcc hello.c -o hello # 编译
xcrun: error: invalid active developer path (/Library/Developer/CommandLineTools), missing xcrun at: /Library/Developer/CommandLineTools/usr/bin/xcrun
! ./hello # 执行
Hello, world!
Jupyter 魔术命令#
%lsmagic
Available line magics:
%alias  %alias_magic  %autocall  %automagic  %autosave  %bookmark  %cat  %cd  %clear  %colors  %config  %connect_info  %cp  %debug  %dhist  %dirs  %doctest_mode  %ed  %edit  %env  %gui  %hist  %history  %killbgscripts  %ldir  %less  %lf  %lk  %ll  %load  %load_ext  %loadpy  %logoff  %logon  %logstart  %logstate  %logstop  %ls  %lsmagic  %lx  %macro  %magic  %man  %matplotlib  %mkdir  %more  %mv  %notebook  %page  %pastebin  %pdb  %pdef  %pdoc  %pfile  %pinfo  %pinfo2  %popd  %pprint  %precision  %profile  %prun  %psearch  %psource  %pushd  %pwd  %pycat  %pylab  %qtconsole  %quickref  %recall  %rehashx  %reload_ext  %rep  %rerun  %reset  %reset_selective  %rm  %rmdir  %run  %save  %sc  %set_env  %store  %sx  %system  %tb  %time  %timeit  %unalias  %unload_ext  %who  %who_ls  %whos  %xdel  %xmode

Available cell magics:
%%!  %%HTML  %%SVG  %%bash  %%capture  %%debug  %%file  %%html  %%javascript  %%js  %%latex  %%markdown  %%perl  %%prun  %%pypy  %%python  %%python2  %%python3  %%ruby  %%script  %%sh  %%svg  %%sx  %%system  %%time  %%timeit  %%writefile

Automagic is ON, % prefix IS NOT needed for line magics.
pip install version_information
!pip install version_information
Requirement already satisfied: version_information in /Users/datalab/Applications/anaconda/lib/python3.5/site-packages (1.0.3)
You are using pip version 19.0.3, however version 19.1.1 is available.
You should consider upgrading via the 'pip install --upgrade pip' command.
# install version_information in the terminal first.
%reload_ext version_information
%version_information numpy, matplotlib, pandas, scipy, statsmodels
| Software | Version |
|---|---|
| Python | 3.5.4 64bit [GCC 4.2.1 Compatible Clang 4.0.1 (tags/RELEASE_401/final)] |
| IPython | 6.2.1 |
| OS | Darwin 18.6.0 x86_64 i386 64bit |
| numpy | 1.16.3 |
| matplotlib | 3.0.1 |
| pandas | 0.23.4 |
| scipy | 1.1.0 |
| statsmodels | 0.9.0 |
| Fri Jun 07 14:29:42 2019 CST | |
References#
{% bibliography %}

